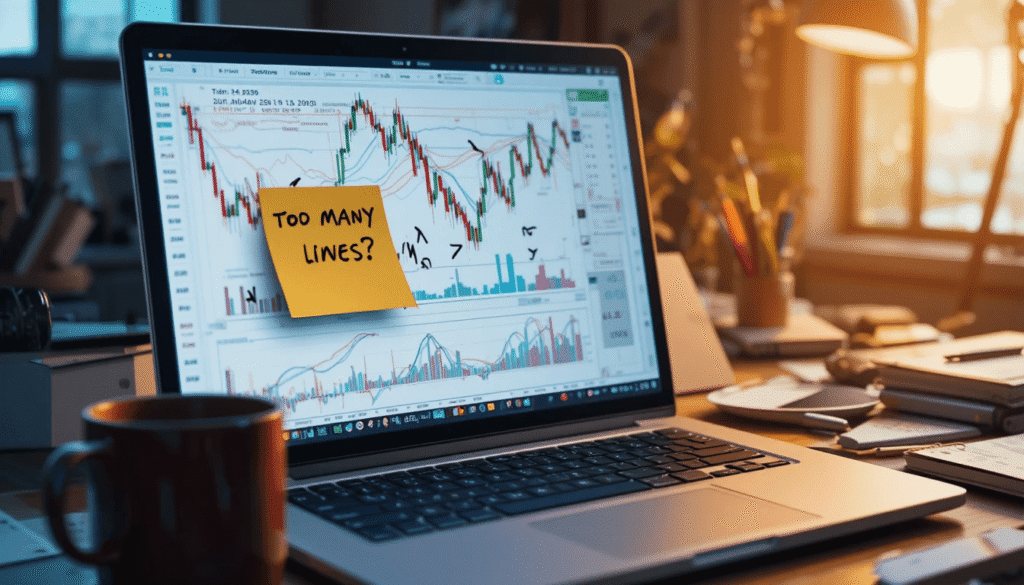
Crypto Trading Indicators Explained in Simple Terms — I wish someone had explained this to me before I turned my chart into what looked like a bowl of neon spaghetti.
Seriously.
I added:
- Moving averages
- RSI
- MACD
- Bollinger Bands
- Volume
- Fibonacci (don’t even ask)
- Something I didn’t fully understand but it looked cool
I leaned back and thought:
“Yeah…absolutely no idea what I’m looking at.”
If you’ve ever opened a chart and felt like you accidentally walked into a physics lecture — same. I’ve written a few hundred blog posts, some helpful, some written while eating cereal at midnight, but indicators? They confused me for way longer than I’d like to admit.
My First Encounter With Indicators
Back in 8th grade, I wore two different shoes to school. Not on purpose. It was a Monday.
That’s exactly how I approached indicators. Mismatched. Overconfident. Slightly chaotic.
I thought:
“More indicators = smarter trading.”
Nope.
More indicators = more confusion.
What Even Are Crypto Trading Indicators?
Simple explanation? They’re tools that try to help you understand price movement.
That’s it.
They don’t predict the future. Don’t guarantee anything. They just… give clues.
Think of them like:
- Weather forecasts
- GPS suggestions
- That friend who says “I have a feeling”
Helpful… but not always right.
The One That Finally Made Sense: Moving Averages
This one clicked for me first.
Moving average = average price over time.
When price is above the line → upward momentum
When price is below → downward momentum
Simple. Clean. Not scary.
I started using just one. My chart suddenly looked… readable.
RSI (The “Overbought vs Oversold” Thing)
RSI stands for Relative Strength Index. Sounds fancy. Not that scary.
It moves between 0 and 100.
- Above 70 → maybe overbought
- Below 30 → maybe oversold
Keyword: maybe.
I once saw RSI at 75 and immediately thought:
“Time to sell.”
Price went higher.
So… yeah. Indicators aren’t magic.
MACD (The One That Took Me a While)
MACD looks intimidating. Lines crossing. Histogram bars. Fancy name.
But simple idea:
It shows momentum.
When lines cross → potential change in trend.
That’s it. No need to overcomplicate.
I used to stare at it like:
“Is this art?”
Eventually… it made sense.
Bollinger Bands (The “Price Bubble” Feeling)
These create bands around price.
When price touches upper band → might be stretched high
Lower band → might be stretched low
Not guaranteed. Just signals.
I like these because they visually show volatility. Also… they look cool. Not gonna lie.
Suggested GIF Spot
👉 Insert GIF of someone zooming into chart intensely
Volume (Underrated But Useful)
Volume shows how much trading is happening.
High volume = more interest
Low volume = quieter market
I ignored volume early. Big mistake.
Price moves with low volume? I now get cautious.
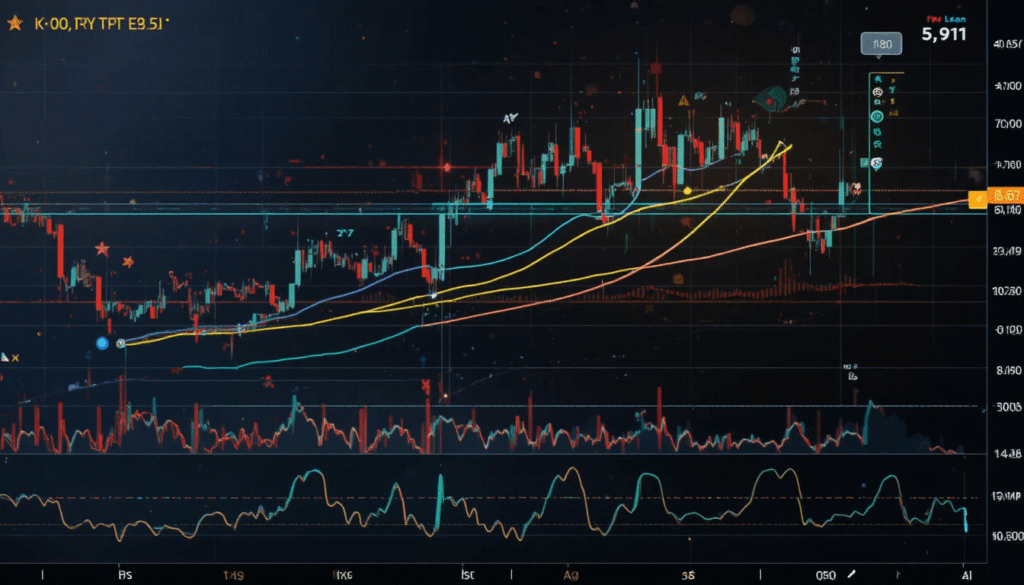
The Mistake of Using Too Many Indicators
This was me:
- RSI says sell
- MACD says buy
- Moving average says hold
- My brain says panic
Too many signals. No clarity.
Now I use fewer. Much calmer.
My “Rule of Three”
I try to use:
- One trend indicator (moving average)
- One momentum indicator (RSI or MACD)
- Volume
That’s it.
Simple. Manageable. Less spaghetti.
Dialogue That Happened
Friend: “Which indicator is best?”
Me: “None alone.”
Friend: “That’s not helpful.”
Me: “Welcome to trading.”
Indicators Don’t Replace Common Sense
This took me a while to accept.
Indicators help… but:
- News matters
- Market sentiment matters
- Timing matters
You can’t just blindly follow lines.
When Indicators Help Most
They’re useful for:
- Spotting trends
- Avoiding impulsive trades
- Confirming ideas
- Adding structure
Not for predicting everything.
When Indicators Confuse You
- Too many applied
- Conflicting signals
- Overthinking every move
Been there. Still happens sometimes.
Suggested GIF Spot
👉 Insert GIF of someone staring at confusing math equations
My Simplest Indicator Setup Today
I use:
- Moving average
- RSI
- Volume
That’s it.
And honestly? It’s enough.
The Emotional Side of Indicators
At first, I wanted certainty. Indicators don’t give that.
They give probabilities.
Once I accepted that, I relaxed.
Beginner Mistakes I Made
- Using too many indicators
- Changing settings constantly
- Trusting one signal blindly
- Ignoring volume
- Overanalyzing
All normal. All fixable.
Suggested Outbound Links
- https://xkcd.com — math confusion humor
- https://waitbutwhy.com — deep thinking reads
My “Less Is More” Realization
One day I removed everything and left just one moving average.
Chart looked clean. Calm. Understandable.
I thought:
“Why didn’t I do this earlier?”
Quick Simple Breakdown
Moving Average → trend
RSI → overbought/oversold
MACD → momentum
Bollinger Bands → volatility
Volume → strength
That’s all you need to start.
Final Thought (Messy and Honest)
Crypto trading indicators aren’t magic. They’re just tools.
Start simple. Use a few. Don’t turn your chart into neon spaghetti like I did.
Because once you understand a couple… everything feels less chaotic.
And honestly? That’s the goal.